
Console
View ▸ Console.
The console shows all the network traffic captured by the firewall — yours as well as the dependencies’ — and renders it as a copyable shell command.
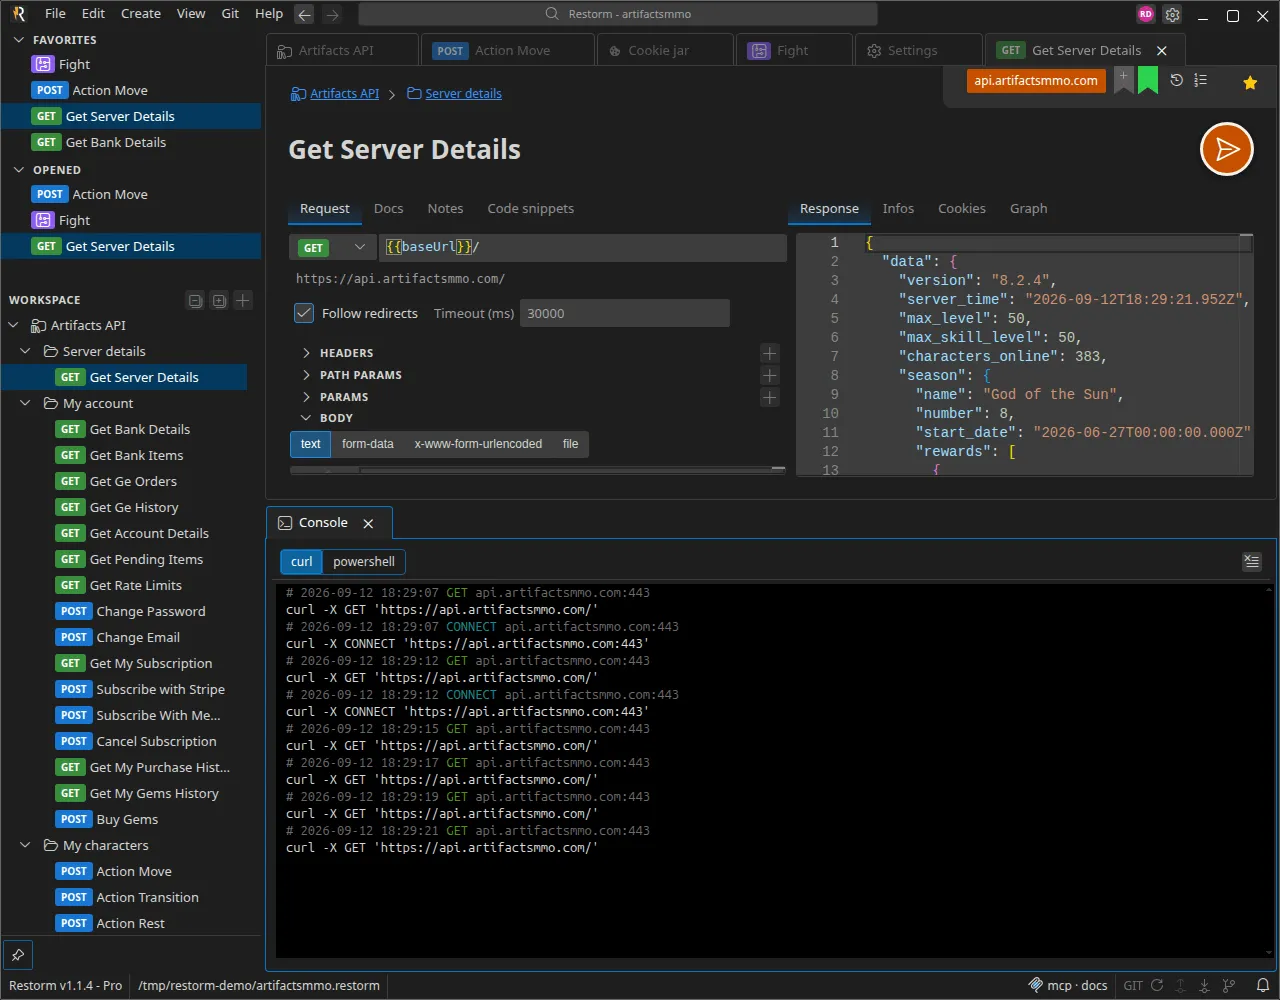
What a block shows
Section titled “What a block shows”A colour-coded header — verb, URL, verdict (allow, deny, pending),
interception layer — followed by the equivalent command.
Formats per protocol
Section titled “Formats per protocol”| Protocol | Command generated |
|---|---|
| HTTP, HTTPS, GraphQL, SOAP, OData | curl or Invoke-RestMethod |
| gRPC | grpcurl |
| WebSocket | wscat |
Switching between curl and PowerShell is done from the console’s toolbar, and the
choice is saved in the Console ▸ Request format setting.
In PowerShell mode, grpcurl and wscat are preceded by a comment noting the
absence of a native equivalent.
Navigating to the source request
Section titled “Navigating to the source request”Clicking a block that came from a project request opens or activates the matching tab. If the request has since been deleted, the row is greyed out and a message explains why.
Filtering
Section titled “Filtering”The internal bridge between the interface and the main process generates traffic of its own. Those records are marked as internal and hidden by default; a Show internal calls switch reveals them.
Gestures
Section titled “Gestures”| Gesture | Effect |
|---|---|
Ctrl+F | Search within the buffer |
Ctrl/Cmd+C | Copy the selection |
Ctrl/Cmd+A | Select everything |
| Clear | Empties the display (the firewall’s records are kept) |
Things worth knowing
Section titled “Things worth knowing”- The sliding buffer keeps roughly 10,000 lines.
- The stream fills up even when no Console tab is open: you can open the console after the fact and find what happened.
- The console is read-only: you do not type into it.
The MCP logs panel
Section titled “The MCP logs panel”That is a separate panel: see MCP logs.
Over MCP
Section titled “Over MCP”open_console, console-logs and console_clear, in the Pro edition. See
MCP tools.